Layout Manager

Dashboard introduced various types of layouts. One layout is a combination of different types of widgets of different sizes. There are predefined layouts bundled with the product. You can create a new custom layout also.

Default Layout

There are predefined layouts bundled with the product, such as: gallery, 2 horizontals, 3 grid, 4 grid, 6 grid, and 9 grid.

Figure 99: Default Layout

Custom Layout

You can also create a new custom layout by specifying the number of rows and columns.

  • If the number of widgets in layout are more than favorite, then other widgets become blank.
  • If the number of widgets in layout are less, then favorite it displays the number of widgets that are available in layout. But if you add a new widget, it automatically adds the next widget graphs from their favorite.
  • You can save a custom layout for future reference. The layout is saved in the Custom Layout section.
Figure 100: Custom Layout

Save Layout

In Save Layout, you can save the custom layouts by providing the layout name. On clicking the Save Layout option, the Save as Custom Layout dialog box will appear as shown in the below figure.

Figure 101: Save as Custom Layout

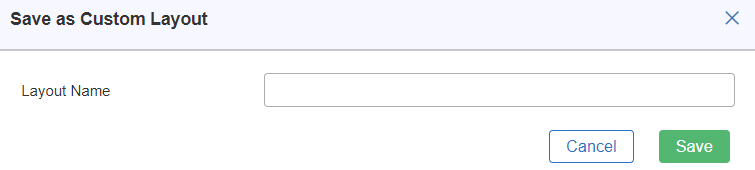
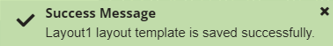
You have to enter the name for the layout in the Layout Name field, and then click on the Save  button. A success message is displayed at the top right corner of the window, as shown in below figure.

Figure 102: Success Message

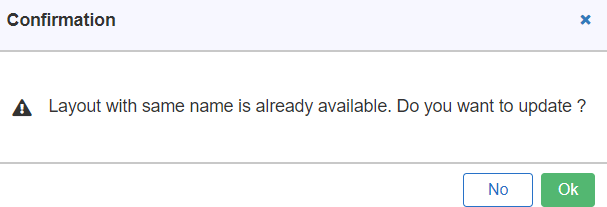
Note: When you try to save a layout with an existing name, an alert message is displayed stating Layout with the same name is already available. Do you want to update? Click on OK  button, to update the layout. If you don’t want to update the layout, then click on No  button.

Figure 103: Confirmation Message

Note: To view the saved custom layout, go to Layout Manager > Custom.

Figure 104: Custom 

Dashboard Lower Panel

Dashboard Lower Panel displays the data of all the graphs of the selected panel. The data is displayed in Tabular format. It is located at the bottom of the Dashboard UI. Lower panel displays statistics of all the metrics of the selected widget.

Figure 105: Dashboard Lower Panel
  • Check Box– This column represents the presence of the graph on the widget. We can show/hide metrics using this.
  • #– This column displays the serial number.
  • Show/Hide Graph: This column represents the presence of the graph on the widget.
  • Graph Number: This column displays the graph serial number.
  • Color: This column displays the color of the graph.
  • Metric Name: This column represents the metric name.
  • Min: This column displays the minimum value of the data sample of the graph.
  • Max: This column displays the maximum value of the data sample of the graph.
  • Avg: This column displays the average value of the data sample of the graph.
  • StdDev: This column displays the standard deviation of the data samples of the graph.
  • Last: This column displays the last value of the data sample of the graph.
  • Count: This column displays the total number of samples.
  • #Time Series– This column displays the count of metrics involved to create the current aggregated metrics.


You can perform the following actions on the lower panel:

  • Download: This option is used to download the metric details in: PDF, Excel, or Word
  • Configure the columns to show/hide: This option is used to show/hide a column in lower panel.
  • Increase the size of the panel: This option is used to increase the size of the lower panel.
  • Decrease the size of the panel: This option is used to decrease the size of the lower panel.
  • Show/Hide Pagination: This option is used to show or hide the pagination.
  • Enable/Disable Filter: This option is used to enable or disable filter on the lower panel.
  • Close: This option is used to Close/Exit the lower panel.

Toggle Column: This option is used to Hide/Show a particular column.

Custom Metrics

Custom metrics let user capture application-specific data or client-side system data. The built-in metrics collected by Cloud Monitoring can give user information on backend latency or disk usage. Custom metrics are created by the user by using derived formula. The derived metrics are stored in the Custom Metrics section.

Here, you can perform the following operations (the detailed description is already provided): At Group Level • Open/Merge/Compare Metrics • Add Derived Metrics • Show Description • Remove Node • Parameterize At Metrics Level • Open/Merge/Compare Metrics • Add Derived Metrics • Show Description • Remove Metric • View Expression

Here, you can perform the following operations (the detailed description is already provided):

At Group Level

  • Open/Merge/Compare Metrics
  • Add Derived Metrics
  • Show Description
  • Remove Node
  • Parameterize

At Metrics Level

  • Open/Merge/Compare Metrics
  • Add Derived Metrics
  • Show Description
  • Remove Metric
  • View Expression